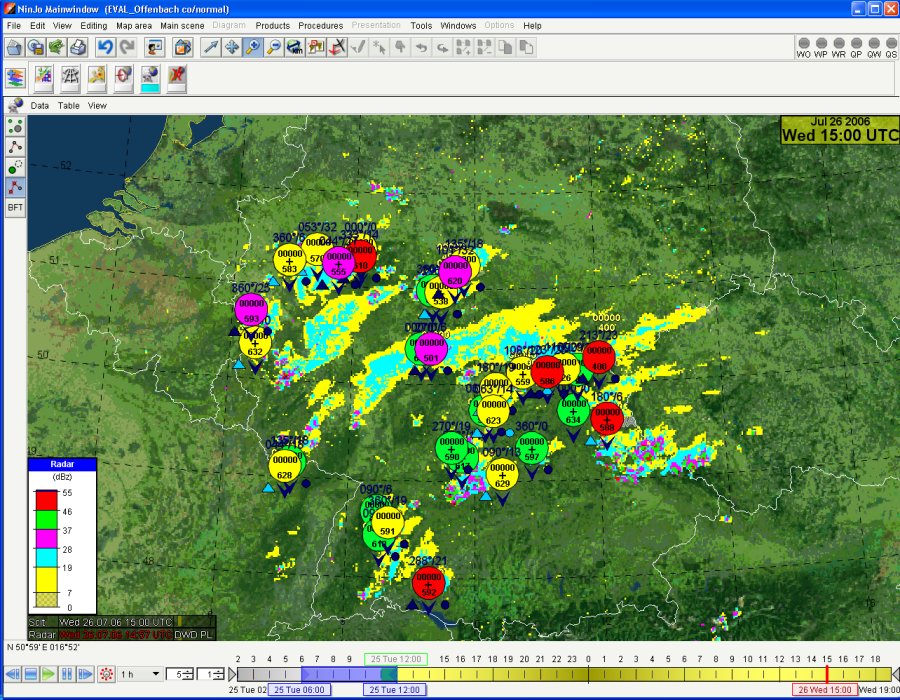
SCIT (storm cell identification and tracking) layer

- Storm cell visualisation at DWD (with radar data)
- Storm cell visualisation at SAWS (with radar data)
- Table with all current cells
- Cell tracking
The SCIT layer displays storm cell data. Storm cells can be visualised as one-size cirles (all cells have the same size, e.g. used at the DWD) or in real size (used at the South African Weather Service).
Cells can be tracked, the movement and velocity can be displayed. All current cells can be listed in a table, the selected cell is displayed seperately at the bottom. Also, if available in the data, secondary cells and cell forecasts can be displayed.