Sounding Layer
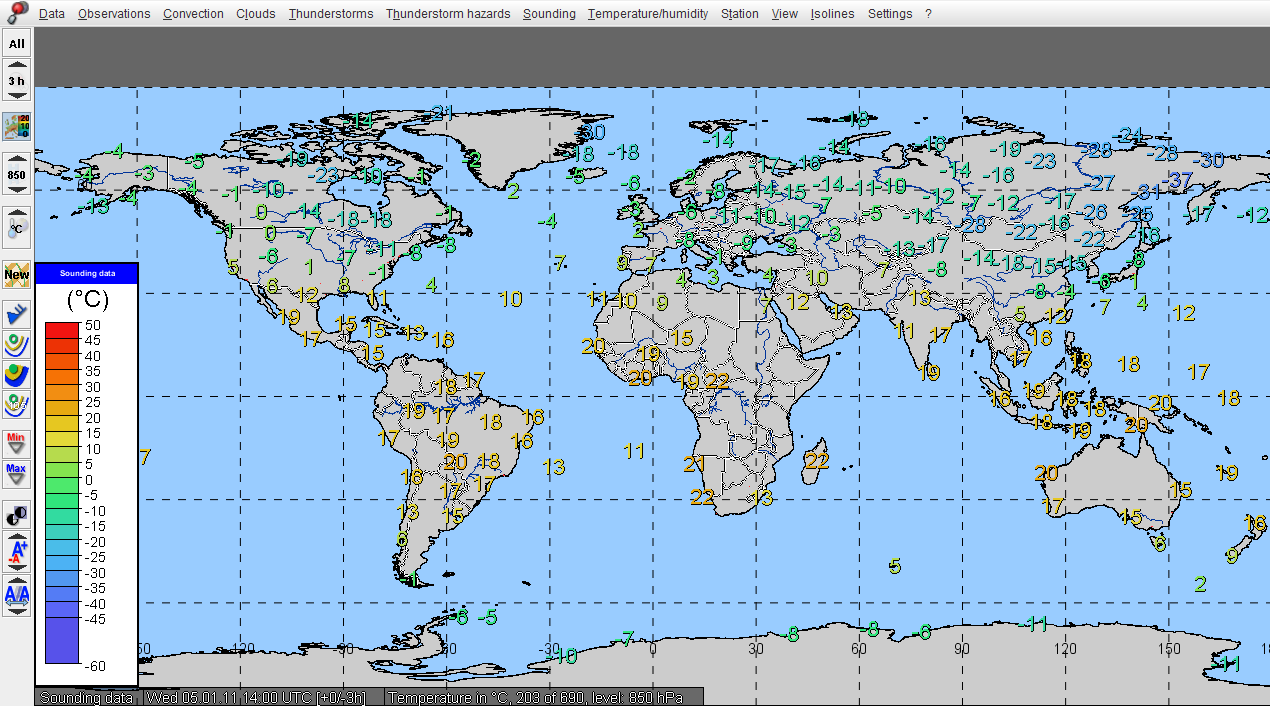
In the Sounding Data Layer, radiosonde measurements and wind profile data as well as derived parameters are visualized as plot elements or plot element groups. In addition, the layer offers easy access to the Sounding Application.
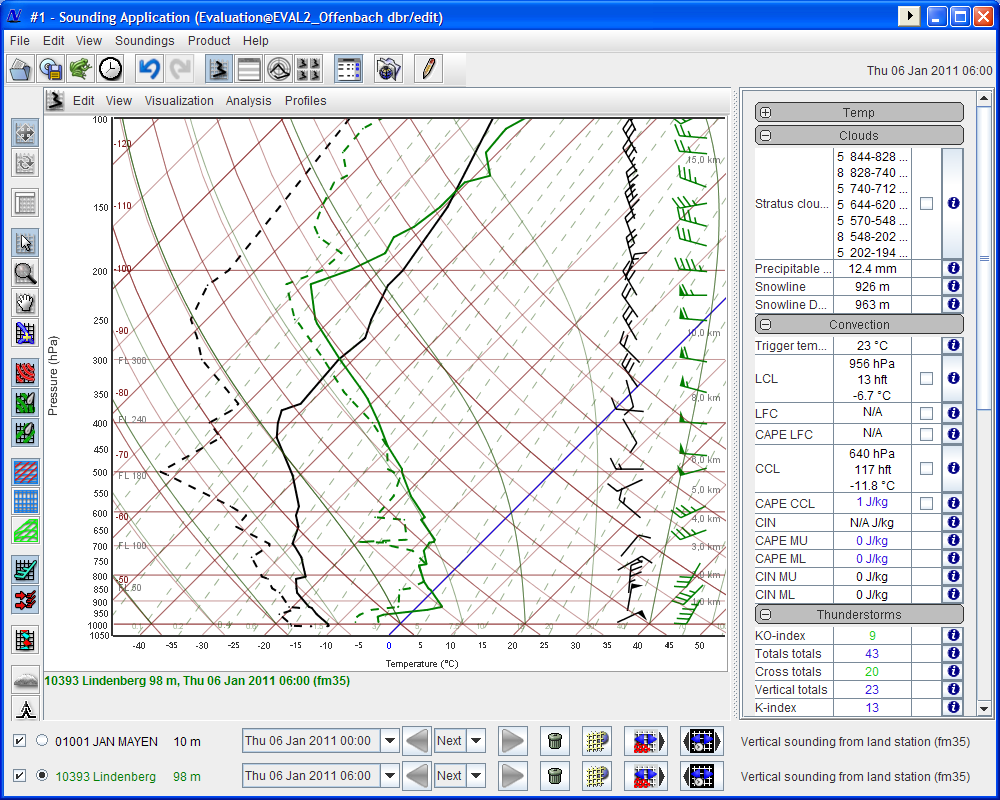
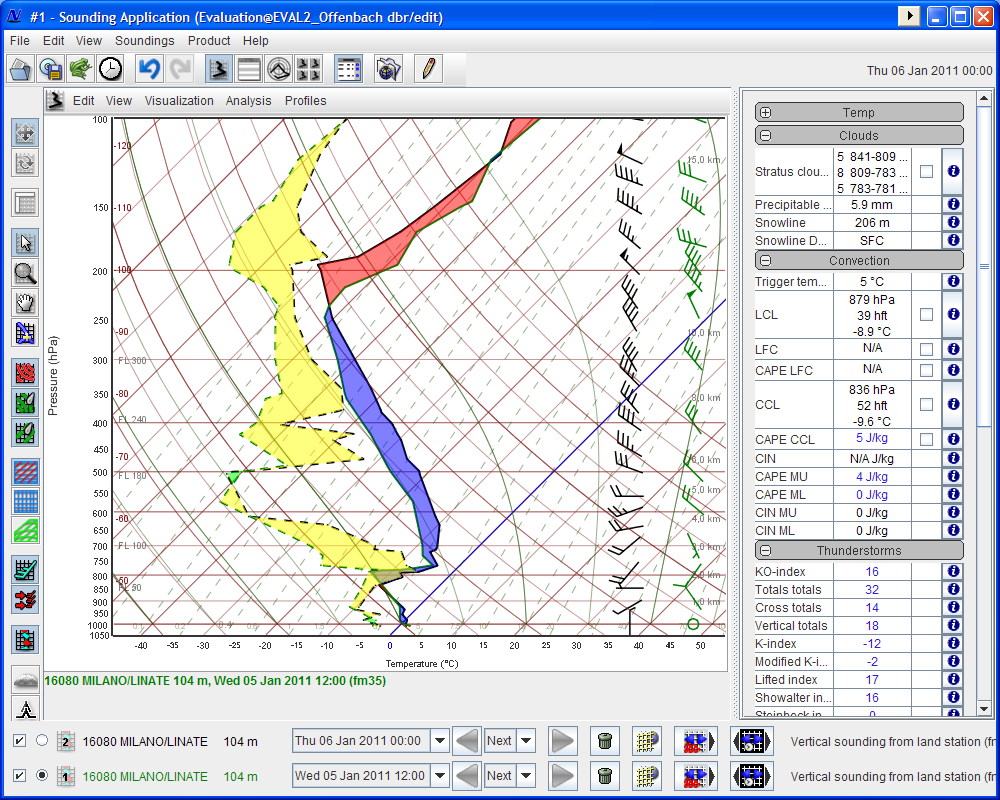
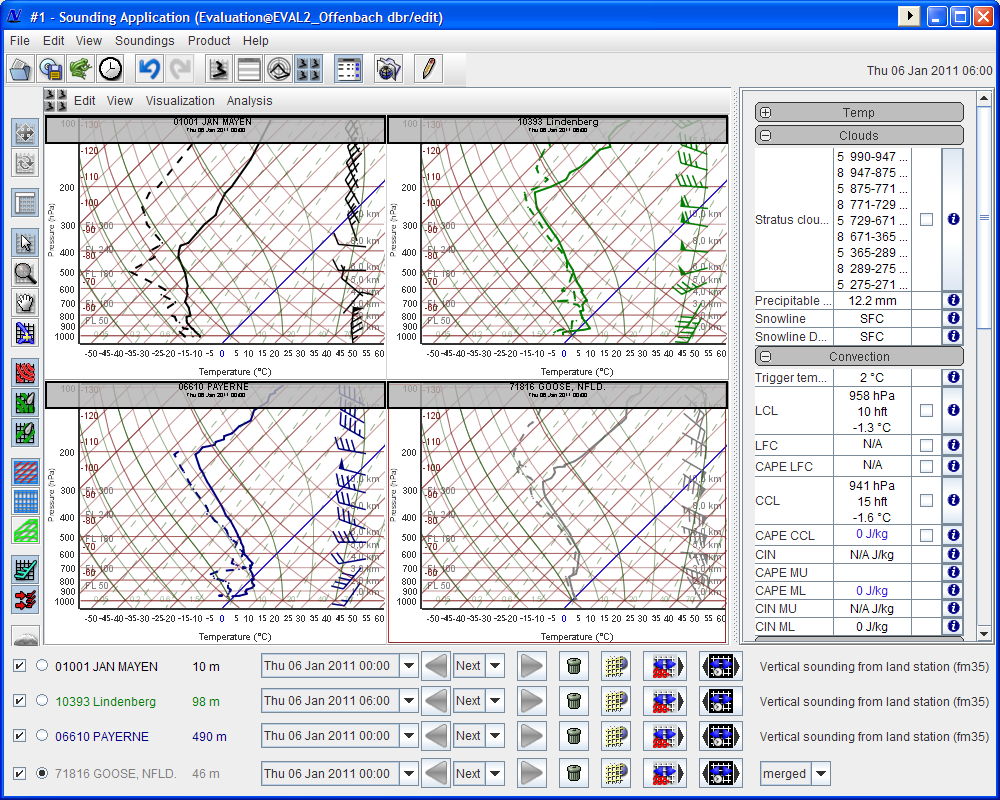
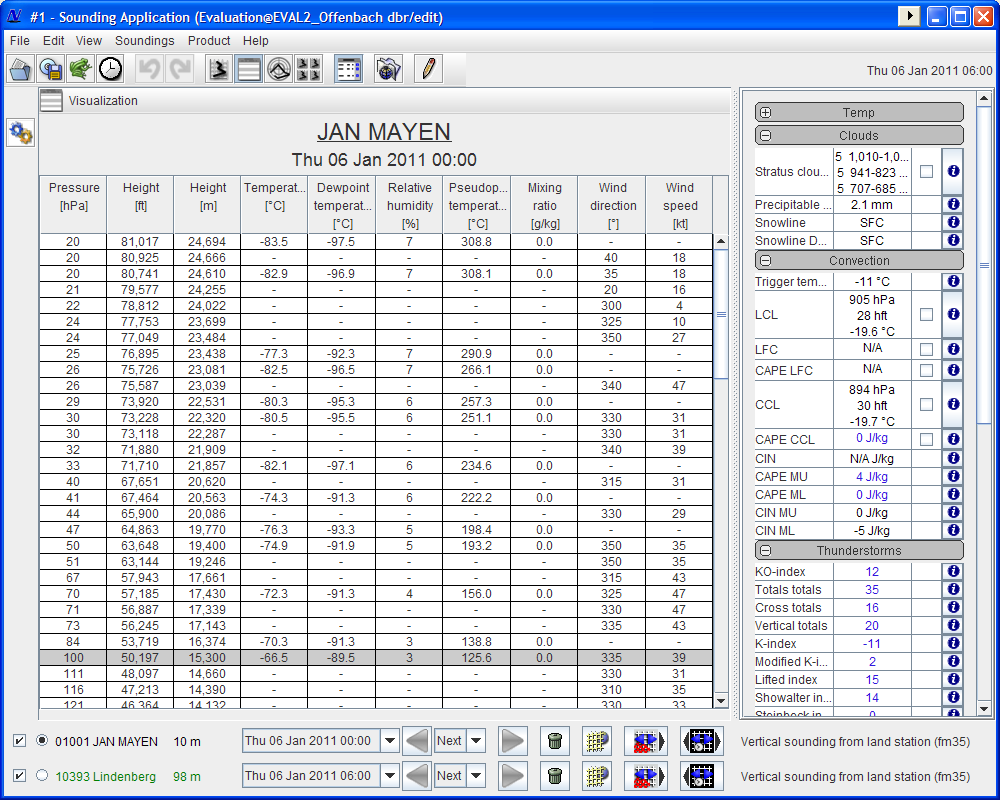
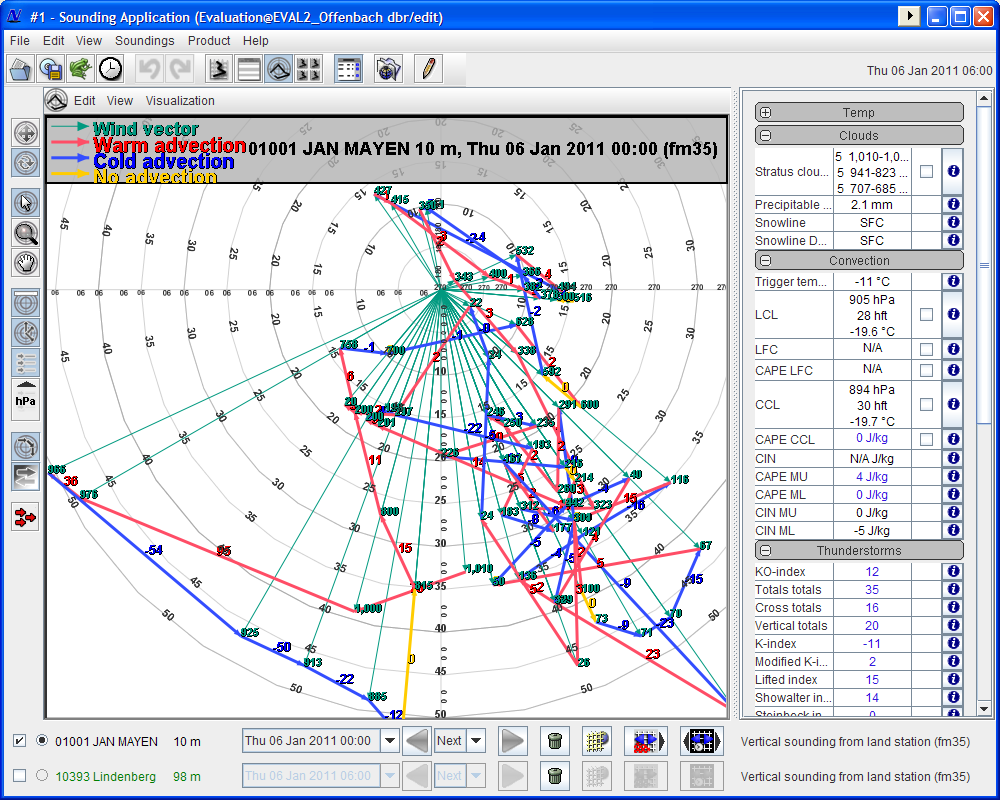
The Sounding Application is used to visualize and analyze data of atmospheric vertical soundings. The sounding data originates from radiosonde ascents, aerological drop sondes, wind profilers or satellites.
Oceanographic soundings from ship measurements and measurements by drifting buoys or profiling floats can be visualized in the Ocean Profile Application. A large number of measured and derived parameters, for example different thunder-storm indices, are available from the default configuration of the layer-specific menu.